Statistics
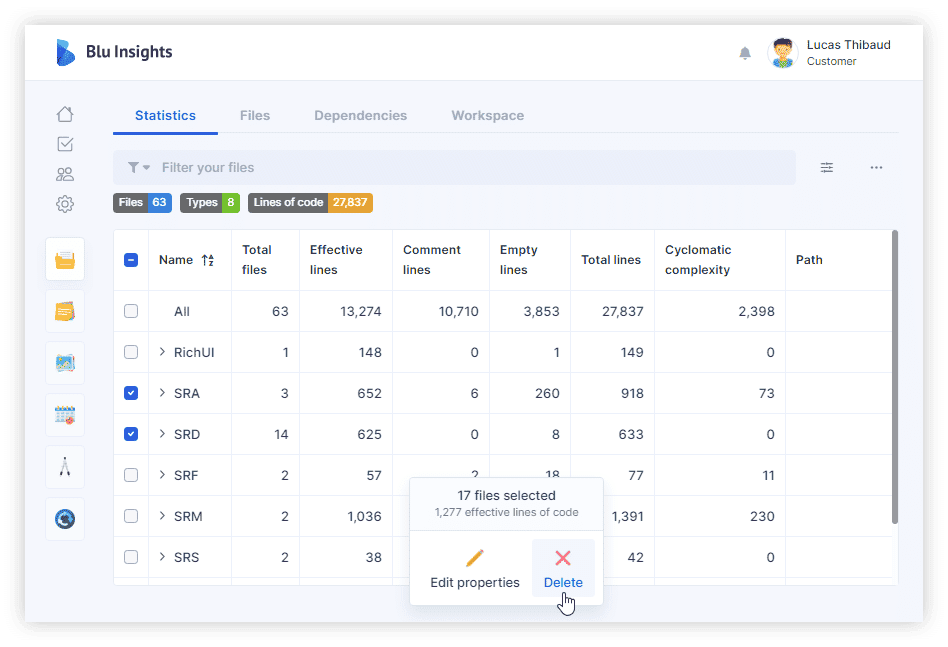
Statistics is the first page opened after the creation of a project. It summarizes the initial metrics (Generic Analysis) of the uploaded codebase presented as a customizable table. Each row of the table represents a detected language (based on file extensions or the classification) except the “All” row which displays the total of each column for all the uploaded files. If you click on the arrow in front of each type, all files of this type appear with their information.
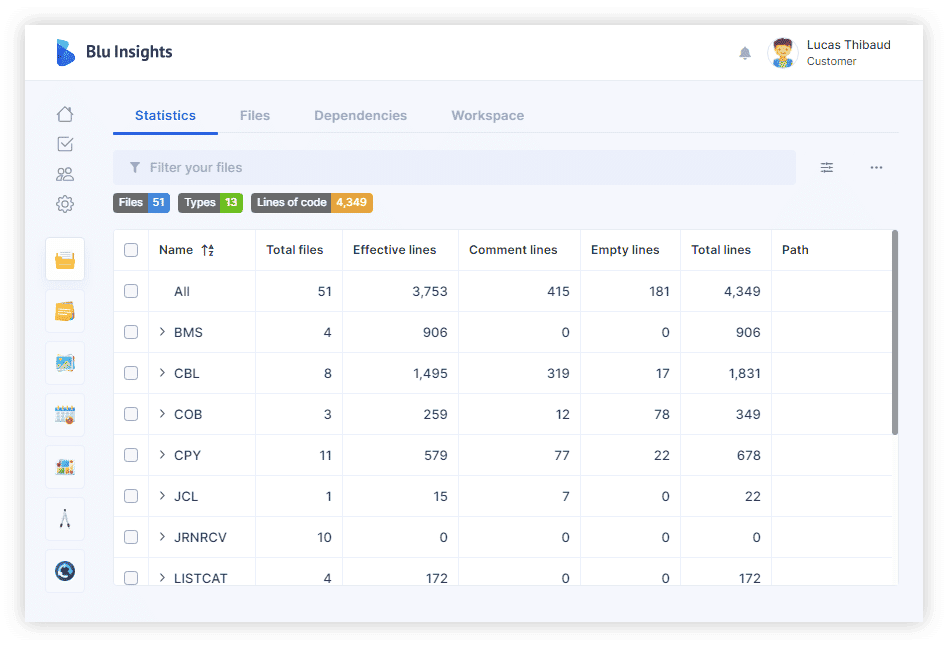
The table columns show the following details:
- Total Files – number of files with the same extension.
- Effective lines – lines of code excluding comments and empty lines.
- Comment lines – number of comment lines detected according to the comment pattern of the detected programming language.
- Empty lines – number of blank lines.
- Total lines – number of lines found in the files (including empty and comment lines).
The column settings menu at the top right allows you to hide these columns and add new ones.
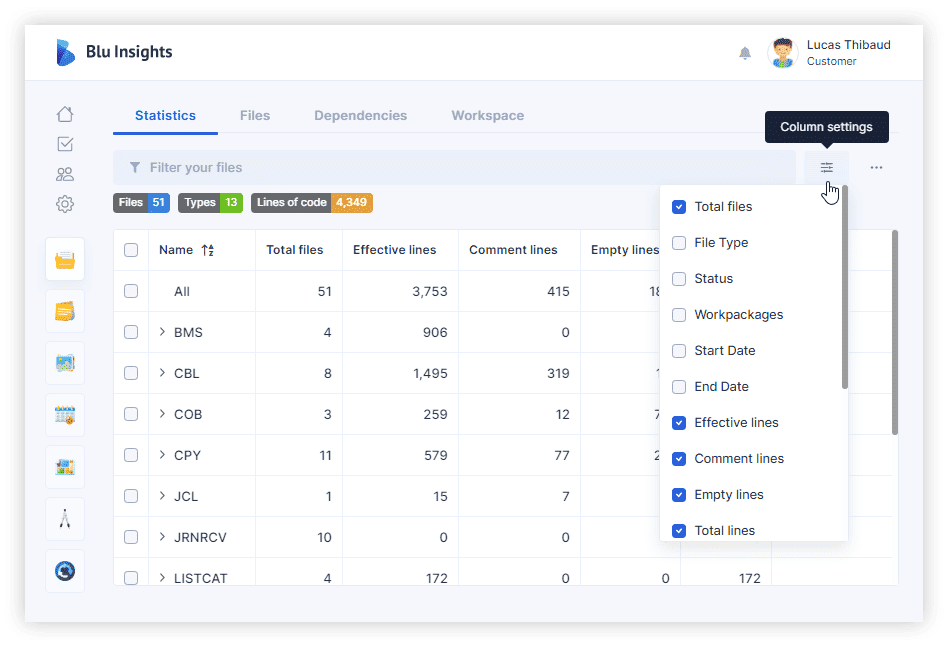
- Cyclomatic Complexity is the code complexity of one or more files. You have to launch the analysis to add this column.
- File type – based on the file extension or the classification result.
- Workpackages – the list of workpackages containing the file.
- Status – custom status associated with the file.
- Start Date and End Date – dates associated with the file.
- Assigned to – the avatar and the name of the project member to whom the file is assigned.
- Labels – tags associated with the file.
- Comments – any comment posted on the file displayed in tooltips.
- Issues – Issues (imported from a bug tracker) associated with the file. This column is related to the project Boosters.
- CI/CD Jobs – Continuous Integration jobs associated with the file. This column is related to the project Boosters.
- Path – the path of the file in the imported codebase archive.
The filter bar at the top of the page allows you to filter your files. The badges below give you general information about your project (the number of files, types, and lines of code).
Analysis and Extraction
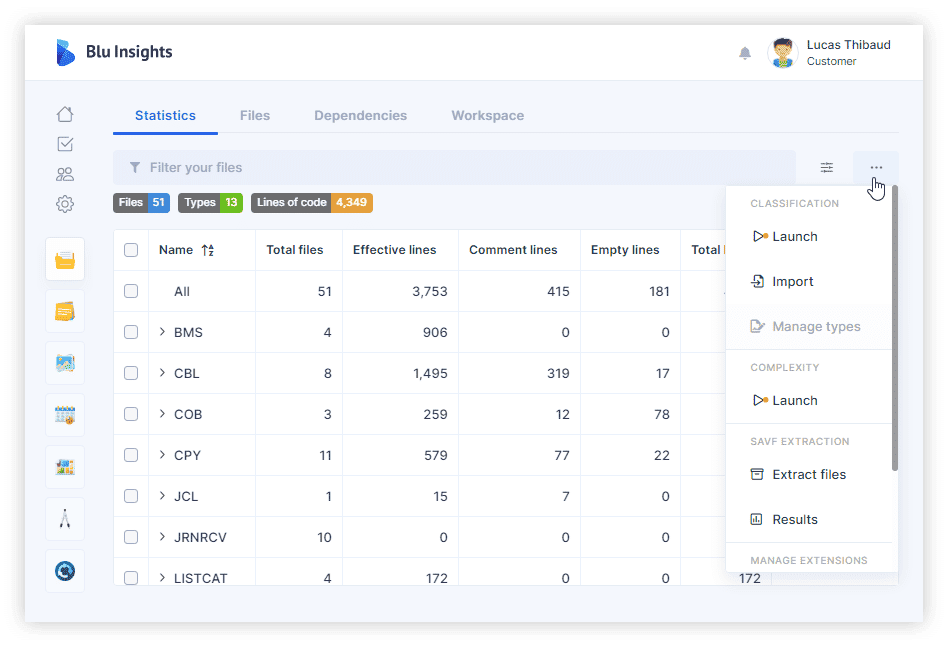
The “…” icon opens the main menu of the Statistics page allowing to perform different actions :
- Classification: launch the analysis, import your own classification, download a JSON or view the results of the classification.
- Complexity: launch the analysis.
- Duplicated IDs: launch the analysis and view the results of duplicated program IDs.
- Manage Extensions.
- ZIP Extraction.
- SAVF Extraction.
- PBL Extraction.
- Export to Excel.
- Download files: download the selected files in the table. If no file is selected, all the files are downloaded.
Edit and Delete Files
When one or more files are selected, some options appear at the bottom of the page. You can edit the properties of the files (add a status, assigned a member…) or delete them.
View and Compare Files
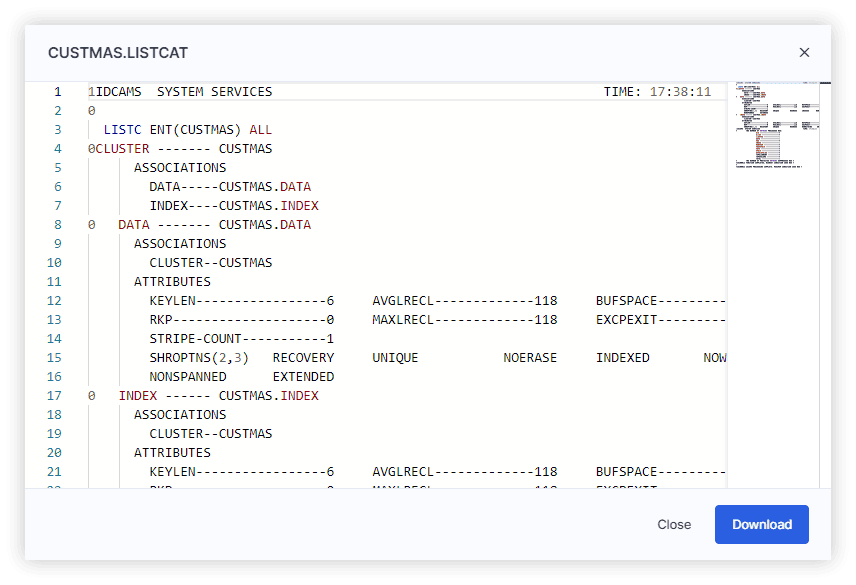
When only one file is selected, you can visualize its content by clicking on the view option. It opens a visualization pop-up and you can also download the file. Some files are not viewable because of their type, such as ZIP files, SAVF files, etc.
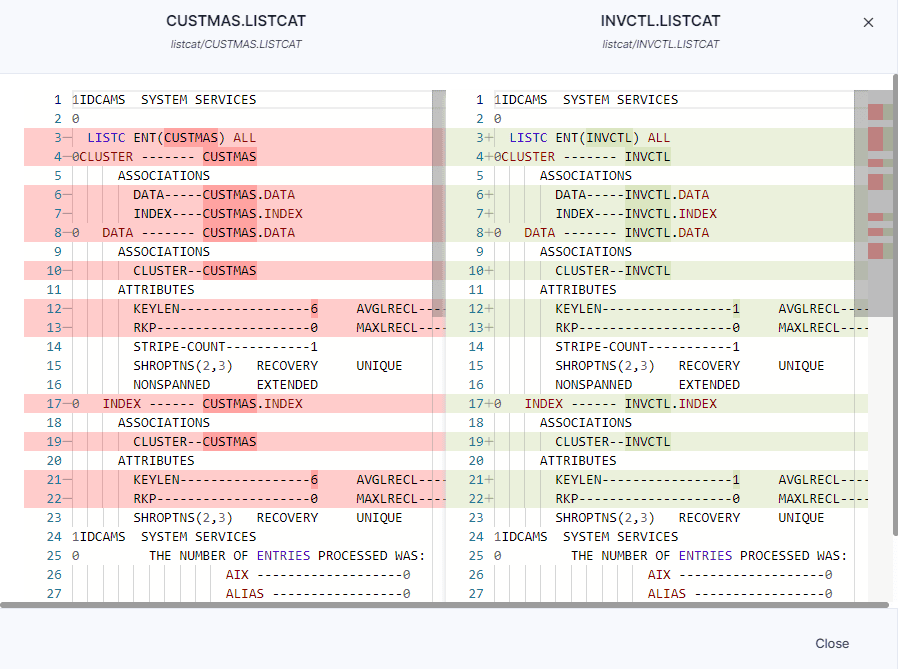
When two viewable files are selected, you can compare their content by clicking on the compare option. It opens a pop-up that shows you the differences between the files line by line.
