Calibration
Browse Calibration results
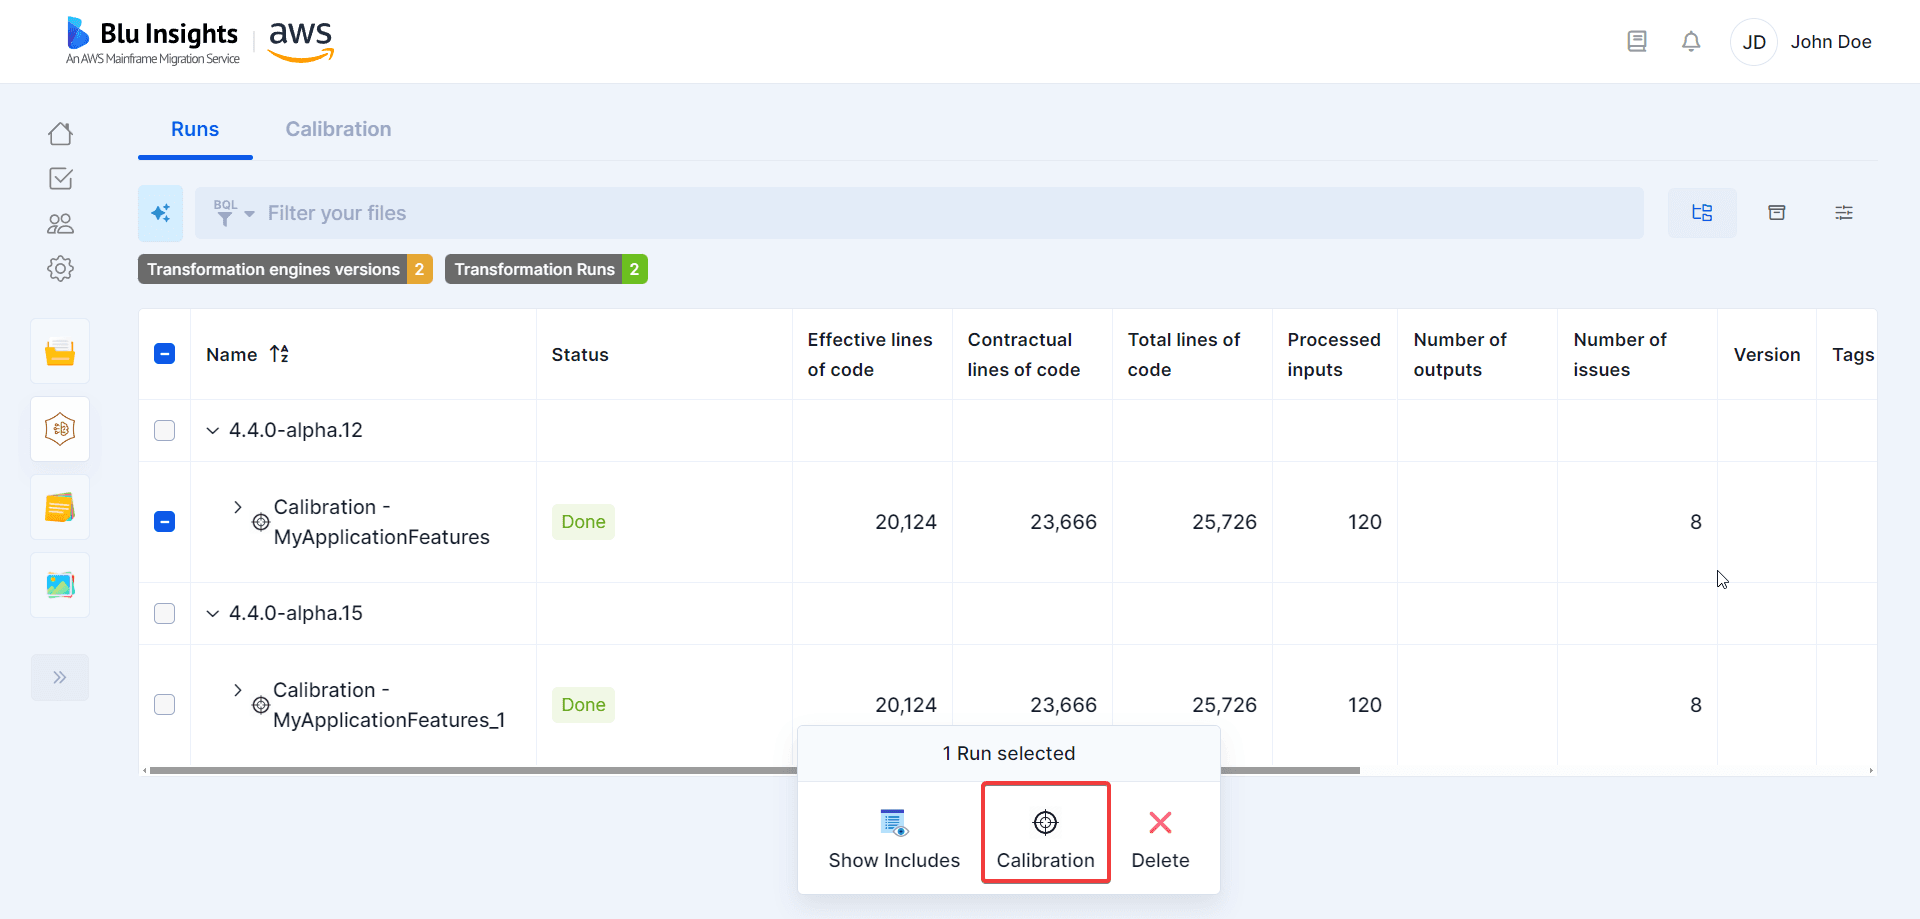
To analyze the results of the calibration, you can use the calibration feature from the Velocity Runs.
Calibration Table
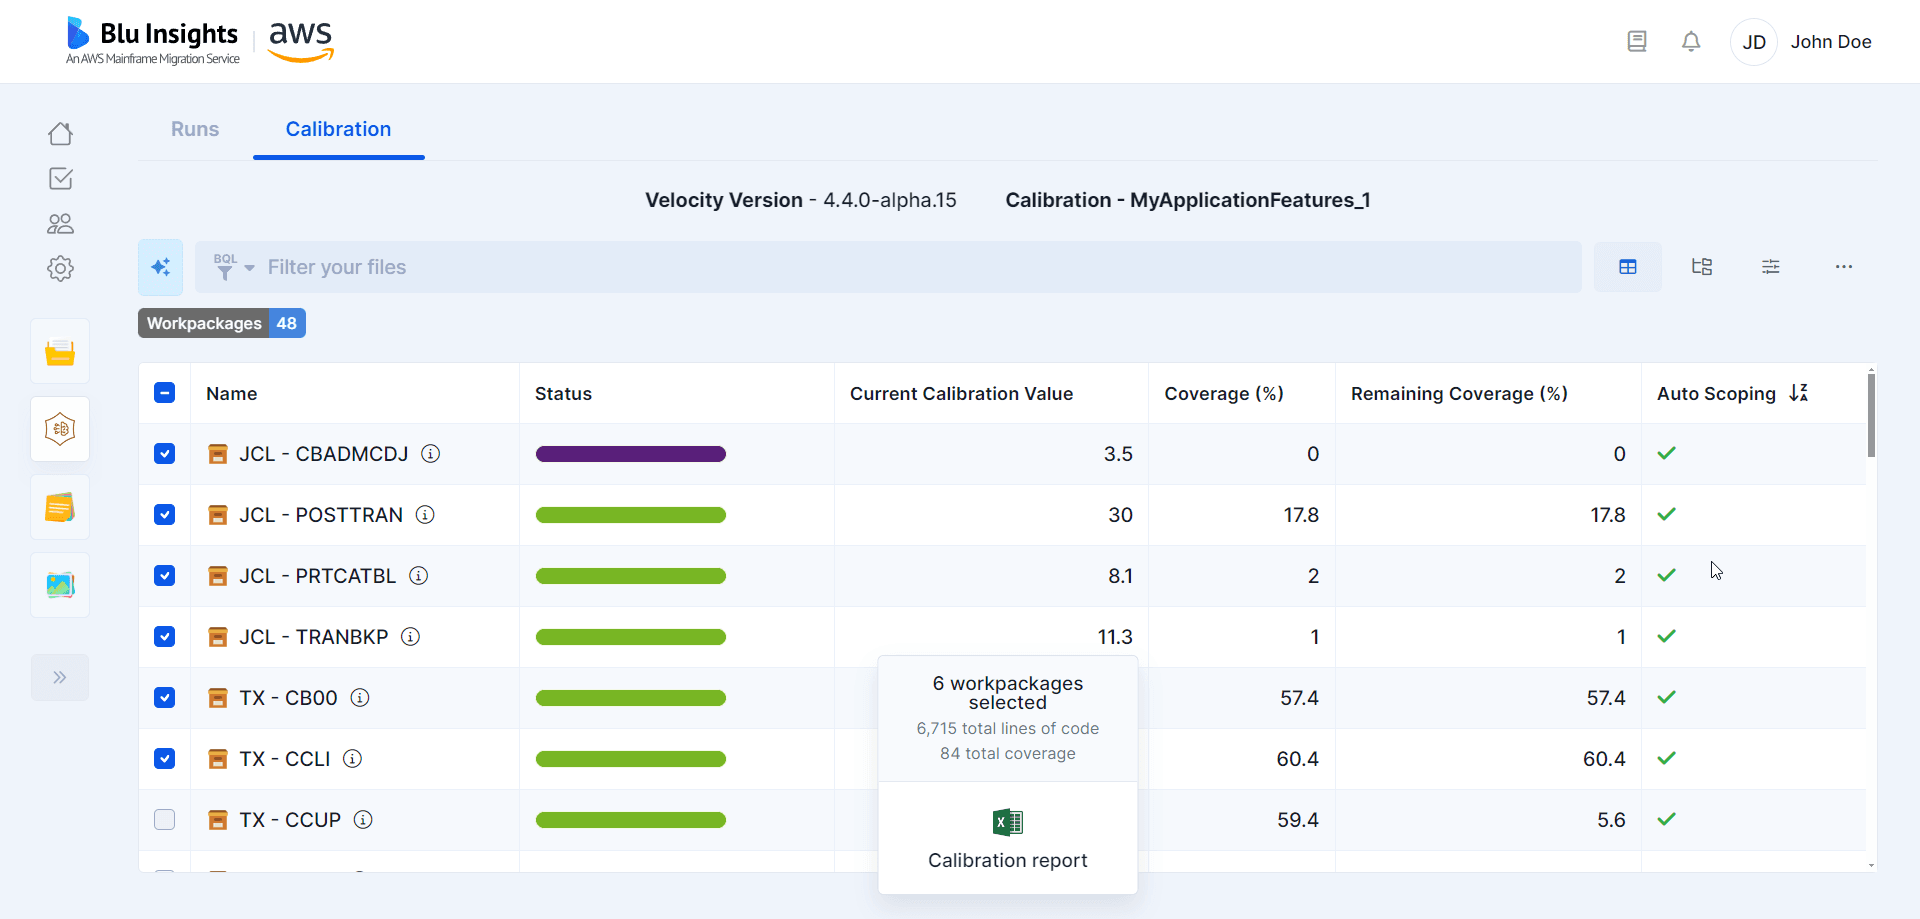
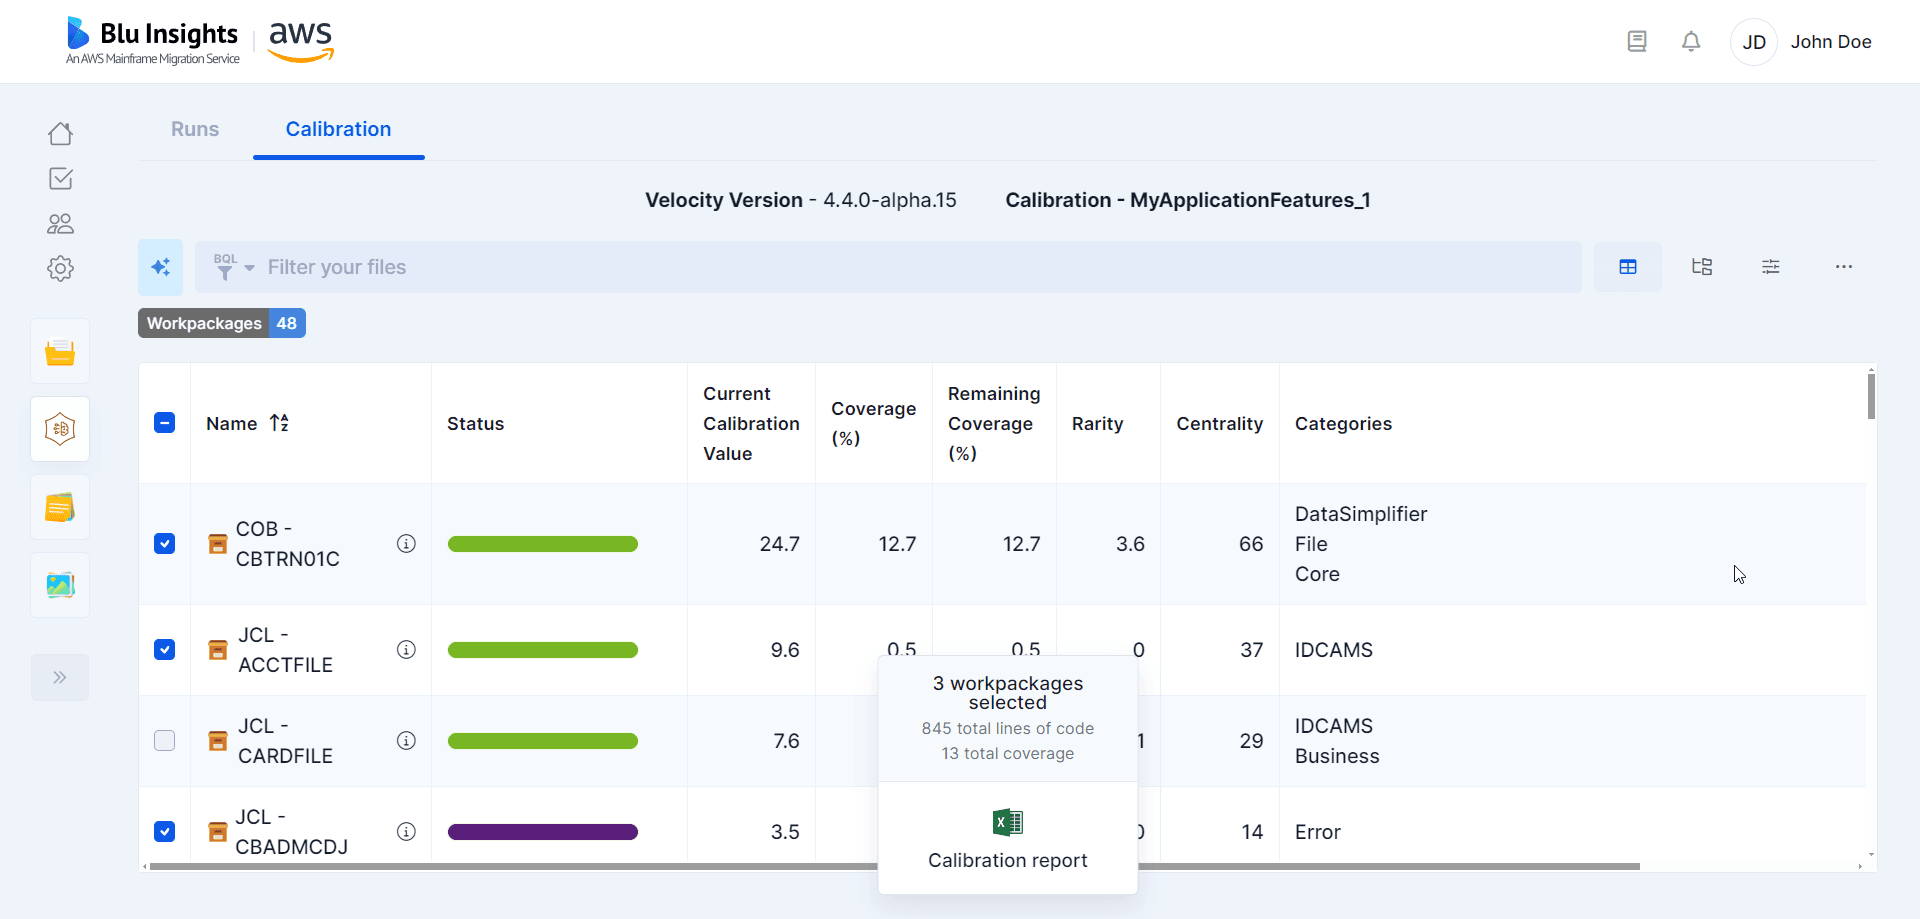
The calibration results will be displayed in a table, which will highlight metrics from the calibration run, such as the coverage of each workpackage, or the centrality. This table proposes two different views:
- Workpackage view: The Workpackage view organizes the results simply by workpackages with only files as children. Each line corresponds to a workpackage and its metrics.
- Categories view: The Categories view organizes the results by categories, displaying all the workpackages as children of each category.
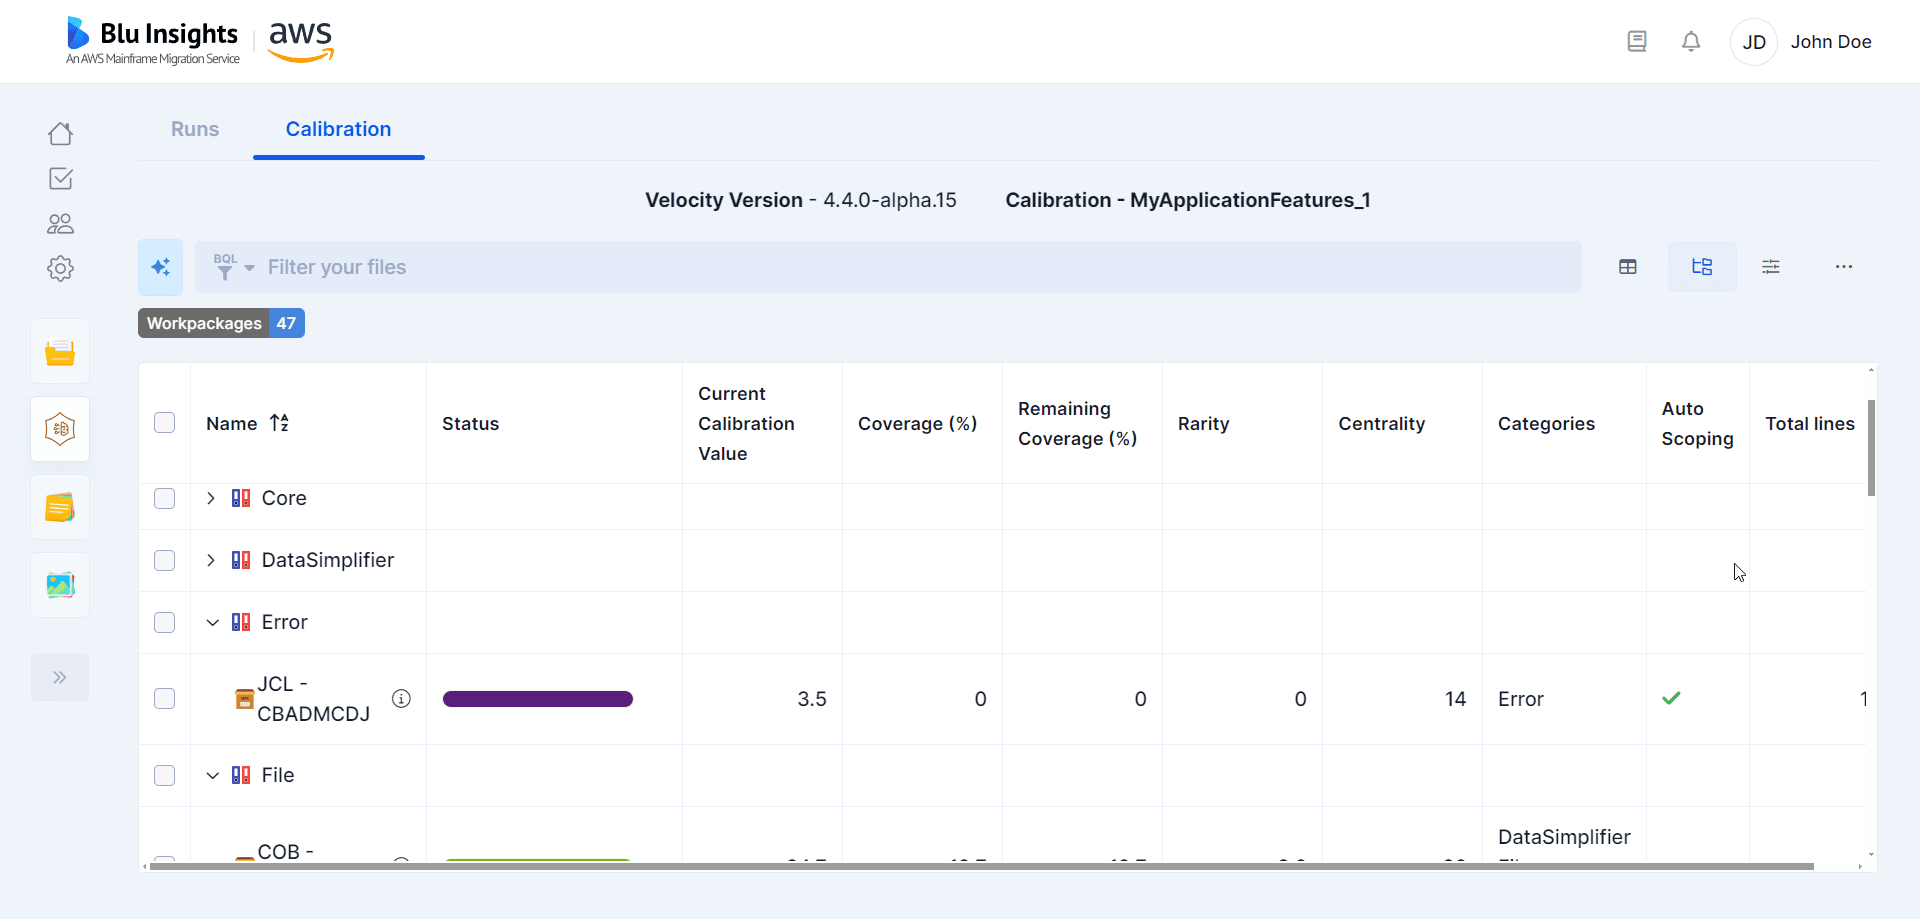
The different columns that can be displayed are:
- Status: the percentage of files that are in error in the transformation run.
- Current Calibration Value: a value computed from the coverage, the centrality and the rarity, representing the “potential” of this workpackage as a candidate for the calibration scope (between 0 and 100). When selecting or deselecting a workpackage, this value is updated to reflect the change in coverage.
- Coverage: The percentage of code patterns types present in the DSL file (relative to all the code patterns types in the workpackages).
- Remaining coverage: The percentage of remaining coverage that the workpackage can contribute to a calibration scope (updated when selecting or deselecting a workpackage).
- Rarity: Value indicating the mean rarity of the code patterns in the DSL file (i.e. the ratio of the number of occurrences of the code pattern in the DSL file to the number of total occurrences of the code pattern in all the DSL files).
- Centrality: Value computed from the links between (inbound and outbound) the DSL file and other files, and their neighbors’ values.
- Categories: Each code pattern is a part of a bigger Category group that contains multiple code patterns types. Displays the list of categories contained in the workpackage.
- Total files: The number of files in the workpackage.
- Total lines: The number of lines in the workpackage.
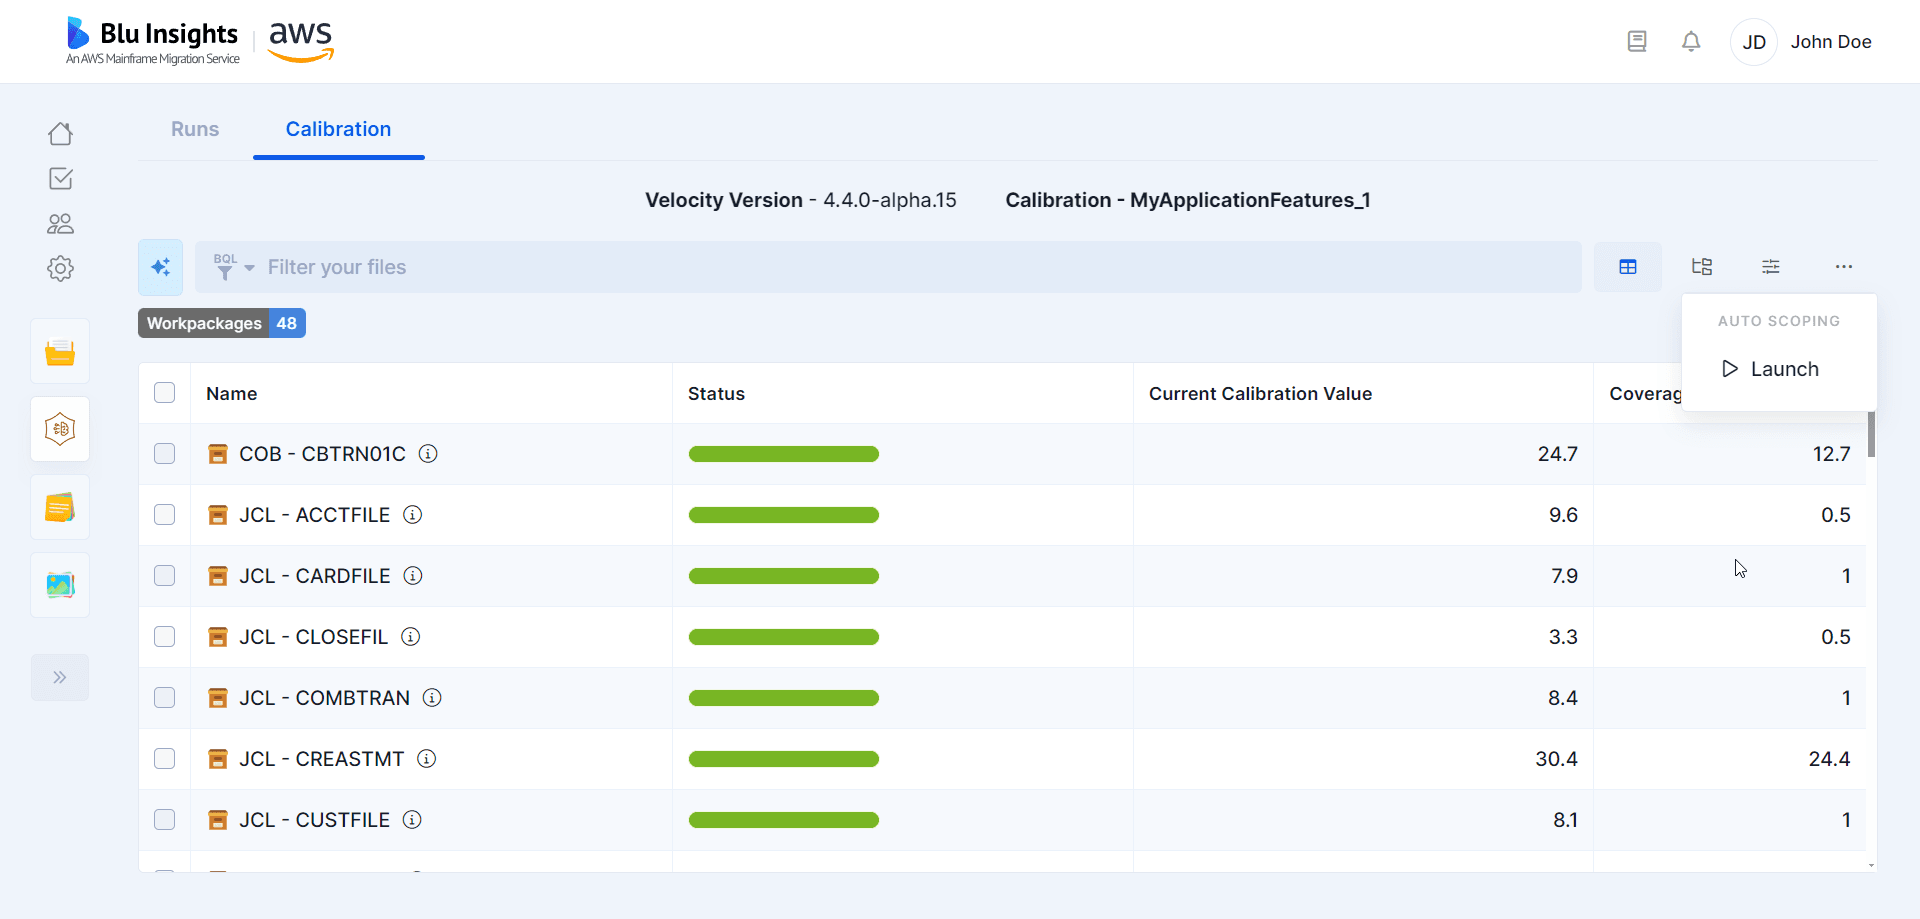
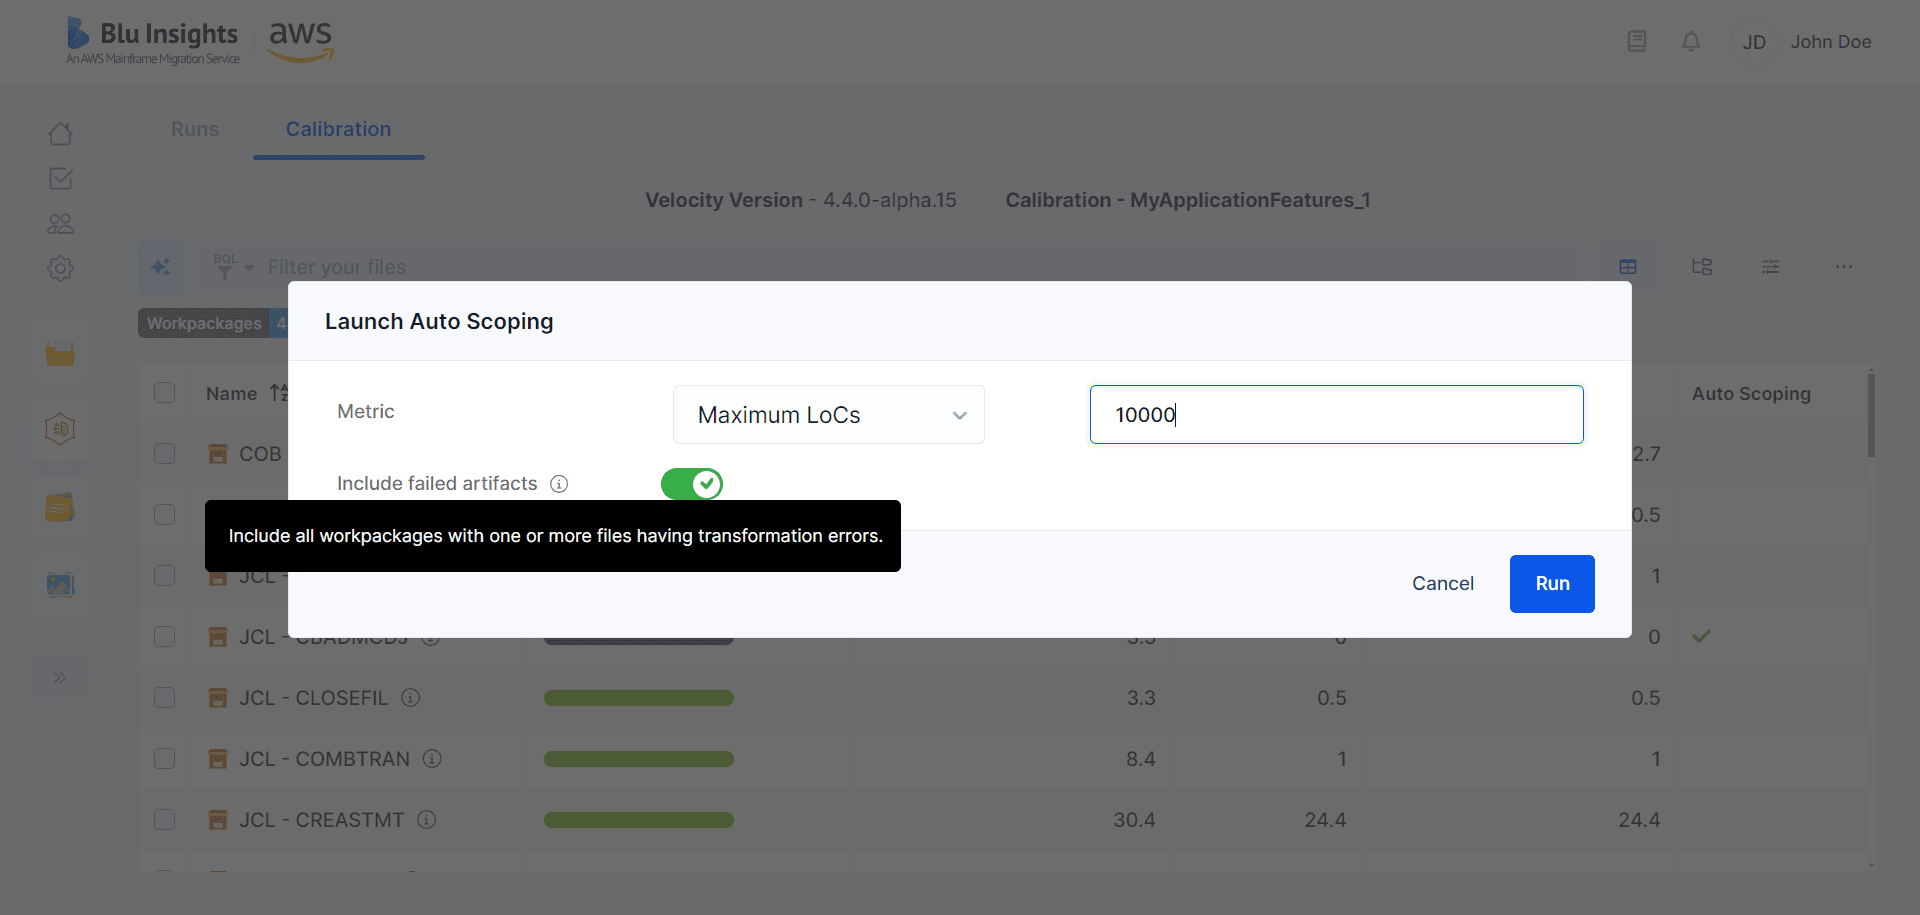
Auto scoping
To further help you choose a calibration scope, an automatic process called auto scoping can be used. This process takes the different metrics computed during the transformation step, and some restrictions that you provide (the maximum number of lines of codes or the maximum number of workpackages wanted in the calibration scope, and whether to include the workpackages containing errors), and finds the most valuable combination of workpackages within those constraints.
Download Calibration report
In order to further exploit the calibration scope you selected, you can download a calibration report. This report is an excel file that is formatted as an AWS Blu Insights excel import file, that can then be uploaded in a Codebase project. This will create (or move) the selected workpackages to a parent workpackage called Calibration, and the other workpackages to a parent workpackage called Mass Modernization.
